Revista Científica UDO Agrícola
Volumen 9. Número 3. Año 2009. Páginas: 681-699
Periphyton succession in a waste water treatment pond
Sucesión del perifiton
en un tratamiento de aguas residuals
Alex Chuks CHINDAH ![]() 1, Solomon Amabaraye
BRAIDE1, Jonathan AMAKIRI2 and Oluwakemi
Okoba KIOLAWSON AJIBULU1
1, Solomon Amabaraye
BRAIDE1, Jonathan AMAKIRI2 and Oluwakemi
Okoba KIOLAWSON AJIBULU1
1Institute of Pollution Studies, Rivers State
University of Science and Technology, Nkpolu Oroworukwo P M B 5080, Port Harcourt, Rivers State ,
Nigeria and 2Plant Science and Biotechnology, University of Port
Harcourt, Choba, Rivers State, Nigeria. E-mails:
alexchindah@yahoo.com ![]() Corresponding author
Corresponding author
|
Received: 03/05/2009 |
First reviewing ending: 05/01/2009 |
First review received: 08/15/2009 |
|
Second reviewing ending: 08/21/2009 |
Second review received: 08/26/2009 |
Accepted: 08/30/2009 |
ABSTRACT
A study on periphyton succession in the self-depuration
wastewater body exposed to sunlight was conducted for 15 days in a laboratory
pond. The physico-chemical parameters (temperature,
pH, salinity, conductivity, turbidity, total dissolved solids, total suspended
solids, nitrate, phosphate and sulphate) and
biological parameters (periphyton) were determined.
The changes observed in some of the physico-chemical
variables indicated a reduction in biochemical oxygen demand (BOD) (96%),
chemical oxygen demand (COD) (96%), nitrate (93%), phosphate (81%) and sulphate 55%. Periphyton standing
stock was 6.31 x 10⁶ indiv L-1 at
day 15. pH and dissolved oxygen (DO) showed strong
linearity with periphyton standing stock and biomass.
The standing stock and biomass had a positive relationship with the species
dominance index, and an inverse relationship with species diversity. Linear
regression model predicted 70% and 64% potential changes in the periphyton biomass that might be attributed to pH, DO and
BOD, and NO3-, PO4 -3, and SO42-,
respectively. The periphyton assemblages shifted in
dominance from one algal form to another through out
the exposure time, with a total of 50 algal species encountered during the
study. The successional patterns of the periphyton
community revealed that Oscillatoria terebriformis, Lyngbya pseudospirulina, Chlamydomonas reinhardtii,
Euglena pascheri, Lepocinclis
steinii and Oscillatoria chalybaea are useful as bioindicators of municipal wastewater.
Key words: Periphyton, Succession, waste water,
treatment, sunlight
RESUMEN
Se condujo un estudio
sobre la suceción del perifiton en la autodepuración de un cuerpo de aguas
residuales expuesto a la luz solar durante 15 días en un estanque tipo
laboratorio. Se determinaron parámteros físicos (temperatura, pH, salinidad,
conductividad, turbidez, sólidos disueltos totales, sólidos suspendidos
totales, nitrato, fosfato y sulfato) y parámetros biológicos. Los cambios
observados en algunas de las variables físico-químicas indicaron una reducción
en la demanda bioquímica de oxígeno (DBO) (96%), demanda química de oxígeno
(DQO) (96%), nitrato (93%), fosfato (81%) y sulfato (55%). El máximo standing
stock de 6.31 x 10⁶ indiv L-1 se observó para el
perifiton Algunos parámetros físico-químicos tales como pH y oxígeno disuelto
(OD) mostraron una fuerte asociación lineal con el standing stock del perifiton
y la biomasa. El standing stock y la biomasa tuvieron una relación directa
positiva con el índice de la dominancia de especies pero exhibieron una
relación inversa con la diversidad de especies. Los patrones
sucecionales de la comunidad
del perifiton revelaron que that Oscillatoria terebriformis, Lyngbya pseudospirulina, Chlamydomonas reinhardtii, Euglena pascheri, Lepocinclis steinii y Oscillatoria chalybaea son útiles como
bioindicadores de las aguas
residuales municipales. El modelo
de regresión lineal predijo los cambios potenciales en la biomasa del perifiton que puede ser atribuido
al pH, DO y BOD en 70% y NO3-, PO4 -3
y SO42- en 64%. La composición del perifiton cambió en la dominancia
de una forma algal a otra a través del tiempo de exposición con un total de 50
especies del perifiton encontradas durante el estudio.
Palabras clave: Perifiton, succesión, aguas residuales,
tratamiento, luz solar.
INTRODUCTION
The increasing
human population and activities such as expansion of urban centres
and industrial setups have resulted in the generation of different waste types
that are discharged into surface water bodies. Much of these are in solid and
liquid forms consisting of domestic organic and inorganic wastes, spent oil
(crank caseoil), and agricultural pesticides and
fertilizers. The magnitude of these wastes has in recent times increased
several folds and is now of concern to all the stakeholders including the
scientific community (SC), non-governmental agencies (NGO), government agencies
(GA) and other citizens (Chindah 1998).
One of the
freshwater bodies impacted by these activities is the Nta-wogba
stream that receives several point and non-point sources of untreated
industrial and municipal wastes. The stream finally empties into the brackish
water bodies where its impacts on water quality and biological resources
resulting in loss of water integrity, aesthetics and biodiversity.
This freshwater
ecosystem is apriori
capable of self-purification through biological processes (Lakatos
et al., 1997), which depends largely
on the physiographic features of the stream and climatic conditions as wastes
received and discharged are within the carrying capacity of the system (Soler et al.,
1991). Under this circumstance, the effluent load is small and thus capable of
elimination of organic and inorganic pollutants by decomposition and the
absorption of inorganic compounds, through the simultaneous physicochemical and
biological processes (EPA 1983, 1987). With the discharges from these municipal
and industrial settings being overwhelming, results in the inability of the
system to carry the extraneous organic and inorganic load with the concomitant
loss of integrity and the goods and services which it provides.
In spite of
increasing trend in the magnitude of wastes discharged into the natural
environment and the threat posed to these resources as a result of human
activities, little has been achieved in respect of waste treatment process and
the physicochemical and biological interplay in Nigeria (Chindah
et al., 2005; Chindah
et al., 2007). Most of the previous
studies mainly focused on the status of water qualities (RPI, 1985, IPS 1990,
NDES, 2000, NDDC, 2004,) and level of contaminants on water resources (Ajayi and Osibanjo, 1981; Ndiokwere 1984; Ibiebele et al., 1987; Ekweozor
et al., 1987; Powell 1987; Ekweozor et al.,
1987; Amadi et
al., 1997; Okpokwasili and Nwabuzor
1988; Okpokwasili and Olisa,
1991; Chindah, 1998; Joiris
and Azokwu 1999; Chindah
and Sibeudu, 2003).
Little is however
known on wastewater self–depuration that practically requires no external
energy other than sunlight, as well as, oxygen which is essential for the
decomposition of organic matter and is provided in high proportion by the
photosynthetic activities of the microbial communities present in the system (Abeliovich 1986).
Greater efficiency
of the treatment is achieved when the microbes used in the treatment process
are aerobic bioreactors (algae, protozoa or bacteria) and their optimum
environmental conditions for growth provided (EPA 1990 and 2002).
Some of these
studies have implicated periphyton as possible
candidate in wastewater treatment and are gaining worldwide attention (Soler et al.,
1991; Laktos et
al., 1997; EPA 2002). In most developed world, the use of stabilization
ponds as a biological system has assumed great importance based on its economy
in wastewater management and usefulness in production of microorganisms that
mineralize the organic and inorganic components (Oswald 1988 and Ogan 1988).
In order to bridge
the existing gap at Nta-Wogba is located on the
western flank of Port Harcourt city of the Rivers State, Nigeria this area,
this study was undertaken to monitor water quality and successional patterns of
periphyton assemblages with the view of identifying
possible indicator species relating to changes in water quality during the
treatment process.
MATERIALS AND METHODS
Study area
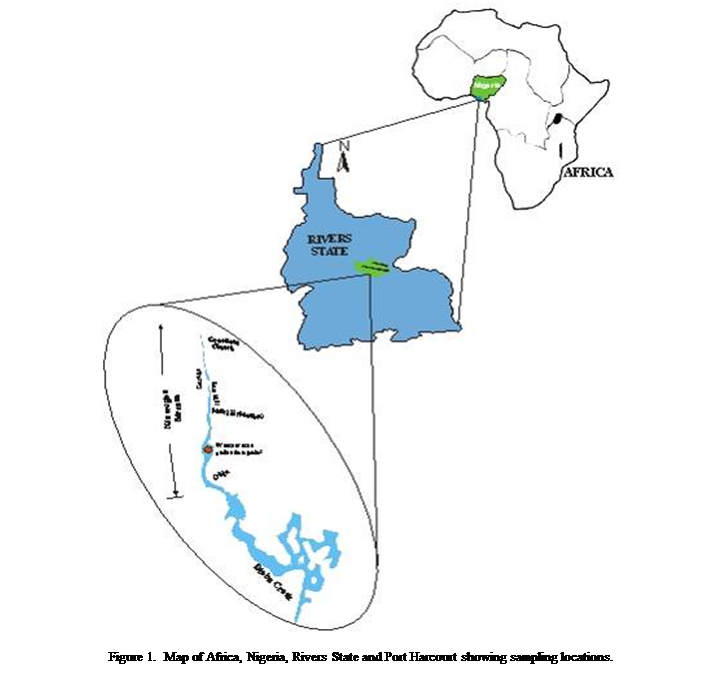
The Nta-Wogba
is located on the western flank of Port Harcourt city of the Rivers State,
Nigeria. The stream lies between latitude 40 50" and 50 00"N and
longitude 60 55" and 70 00"E (Figure 1.). The climate of the area is
that of tropical equatorial latitude with rainfall occurring almost all year
round (Gobo 1998; Gobo et al., 2008).
The Nta-wogba is a black water stream with its head
water draining the Ora-Azi forest, and meanders
through the densely populated city of Port Harcourt into the Bonny
estuary.
The
stream system is exposed to increasing amount of urban wastes as it flows seaward,
mainly from industrial and domestic discharges from laundry, photographic
studios, garages, and wastes from markets and construction sites. The human
activities exert considerable negative impact on the entire study area. It is estimated that the water body receives
about 4500 L/day of waste containing petroleum product, especially from
crankcase oil, over 250,000 L/day from domestic waste, 80 kg/day of human
waste, 20 kg/day of metal, and 58 kg/day of solid waste such as paper and
polyethylene bags.
Rainfall
occurs almost all the months (May - November) of the year with short duration
of dry season (December -April) and an annual average rainfall of 2360mm (Gobo
1988 and Gobo et. al, 2008). The
natural drainage basin is largely exposed as vegetation is virtually removed by
adjacent development with the fringe and water surface covered by macrophytes such as Nymphaea micrantha, N. lotus,
Pistia stratiotes, Eclipta prostrate, Torulinium odoratum, Ludwigia leptocarpa, L. erecta, Ipomea aquatica, Neptuna oleracea , Saccioleis Africana, Cyperus distans, and C. sphacelatus (Chindah et al., 2005; Izonfuo
et al., 2005)
Experimentation
Water
from the study station was collected in pre-cleaned 50 litre
plastic jerry cans to fill two triplicate 50 L polyethylene tanks in the
laboratory. The tanks were left in an open and wide area to avoid shading at
all times. From the tanks, samples for water quality and biological analysis
were conducted for a period of two months. Slide panels in rack were placed in
each of the tanks. The slides were examined under binocular microscope on each
day for the assessment of periphyton.
Sampling collection and laboratory procedures
Physicochemical Parameters
Samples were collected daily with
2ml plastic containers at sub-surface level and analyzed in the Institute of
Pollution Studies (IPS) laboratory using procedures as outlined in Standard
methods for the examination of water and wastewater (10). Temperature was
measured using a mercury bulb thermometer. pH was
measured with a pH meter (Hanna instrument model HI8314). The conductivity was
measured using the Horiba water checker model U-10. Dissolved oxygen (DO), and
biochemical oxygen demand (BOD5) and chemical oxygen demand (COD)
were determined using Winkler’s method as described in APHA (1998). Other
parameters such as ammonia-nitrogen (NH3-N), nitrate-nitrogen (NO3-N),
sulphate (SO4-2), and phosphate
(PO4-3) concentrations were determined spectrophotometrically (Spectronic
Spectrophotometer 21D), following the procedures as described in APHA (1998).
Biological Parameters
Periphyton
Periphyton was collected
daily for a period of 15 days. For each treatment a total of 3 scrapings were
taken by removing a slide from the rack seeded in the wastewater. An area of
1cm2 from each slide was carefully scraped with a sharp edged
scalpel. The first scrapings was emptied
into a plastic vial containing 20 ml of Lugol’s
solution for species identification and numeric analysis; and the second scrapings
was put in a glass vial containing 5ml
of 90% acetone for chlorophyll a analysis (biomass).
From
the original stock sample, duplicate samples for numerical analysis were
obtained by collecting 1ml sub-sample of the properly homogenized sample with a
Stampel pipette. The content transferred into a Sedgewick–Rafter counting chamber for enumeration at a
microscope magnification of 400x, and identification at magnification of 1000x
using the reports of Mills (1932) Sieminiska (1964) Starmach (1974) Patrick and Reimer (1966) Durand and
Leveque (1980) and Chindah and Pudo
(1991).
The chlorophyll a pigment (as mg chlorophyll cm-2)
was determined following Standard methods (APHA 1998). Upon removal from the slides
the material was immediately transferred to labeled tubes containing 5ml of acetone, which was added to the
sample in the plastic vials. This was centrifuged at 450rpm .
The supernatant was carefully transferred to a glass cuvette and absorption measured
at 630nm, 645nm and 660nm using spectrophotometer (Spectronic
21D).
![]()
Statistical
analysis
Species richness,
species diversity index, dominance and evenness were analyzed as indicated
below.
The
species diversity index was determined using the Shannon-weaver's (1964)
function H′ given by the equation:
H′ = - Σ (ni/N) Log (ni/N) i
Where:
ni = The number of species in
group (i),
N = Total number of
species in (i) group.
The
specie dominance index was calculated using the Bergen-parker dominance index (Chellappa 1990):
d = nmax/NT
Where:
nmax = number of
individuals of the dominant species,
NT
= total number of
individuals of all the species recorded.
Physico-chemical and biological
parameters were analyzed using 2-way analysis of variance (ANOVA). F-test, was
conducted evaluate any significant difference between days. Inter-relationship between physicochemical
and biological attributes was evaluated using Excel package 2003. Regression
model was used to predict the relationships between the actual and expected
values amongst some critical variables (physicochemical and biological
parameters) and all calculations were
performed for n = 16 observations.
RESULTS
Physicochemical parameters
The
synopsis of physico-chemical changes observed during
the treatment process is presented in Table 1.
|
Table
1. Physicochemical variables in the wastewater treatment system from Diobu in Port Harcourt, Nigeria. |
|||
|
S/no parameter |
Range |
Mean and SD |
% Recovery |
|
Temperature (ºC) |
26.5 - 32 |
29.24 ± 2.16 |
ND |
|
pH |
7.2 - 9.0 |
7.91 ± 0.50 |
80.00* |
|
Conductivity (µScm-1) |
506 - 706 |
620.87 ± 70.26 |
72.94 |
|
Turbidity (NTU) |
3 - 62 |
22.67 ±
13.36 |
95.2 |
|
TDS ( mg L-1) |
358 - 494 |
440.2 ± 45.81 |
27.1 |
|
TSS ( mg L-1) |
1.74 - 3.19 |
2.746 ± 0.52 |
45.5 |
|
DO ( mg L-1) |
0.23 - 6.00 |
2.01 ± 2.15 |
96,0 |
|
BOD5 ( mg L-1) |
0.92 - 28.5 |
16.25 ±11.86 |
96.8 |
|
COD ( mg L-1) |
0.81 - 19.95 |
11.38 ± 8.31 |
96.8 |
|
Nitrate ( mg L-1) |
0.04 - 0.64 |
0.22 ±
0.16 |
93.75 |
|
Phosphate ( mg L-1) |
0.39 - 4.54 |
2.83 ± 1.36 |
91.4 |
|
Sulphate ( mg L-1) |
8.81 - 16.01 |
12.46 ±2.82 |
45.9 |
|
ND
– not determined, * increased value |
|||
Biological parameters
Species
occurrence and successional patterns
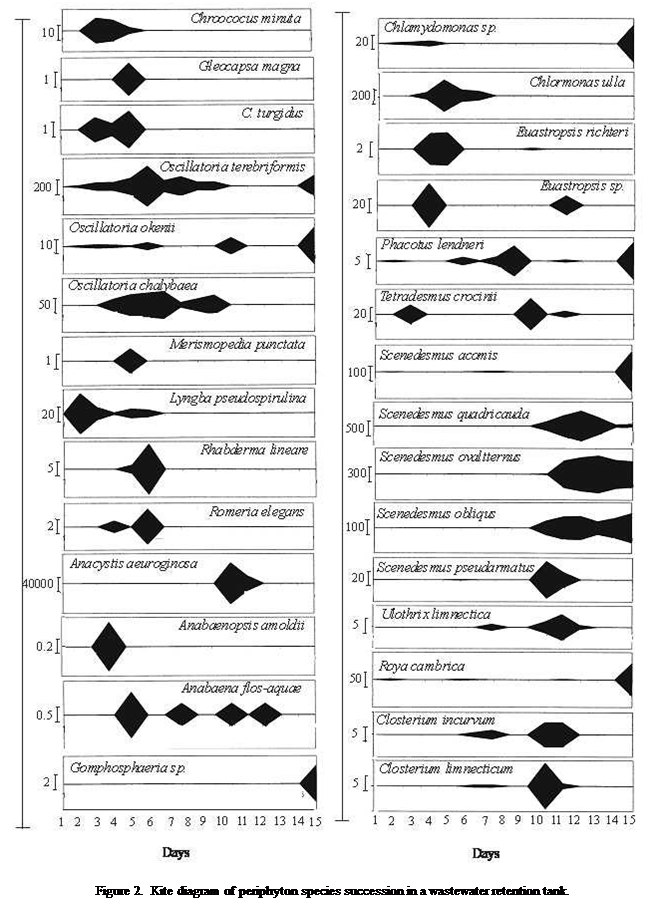
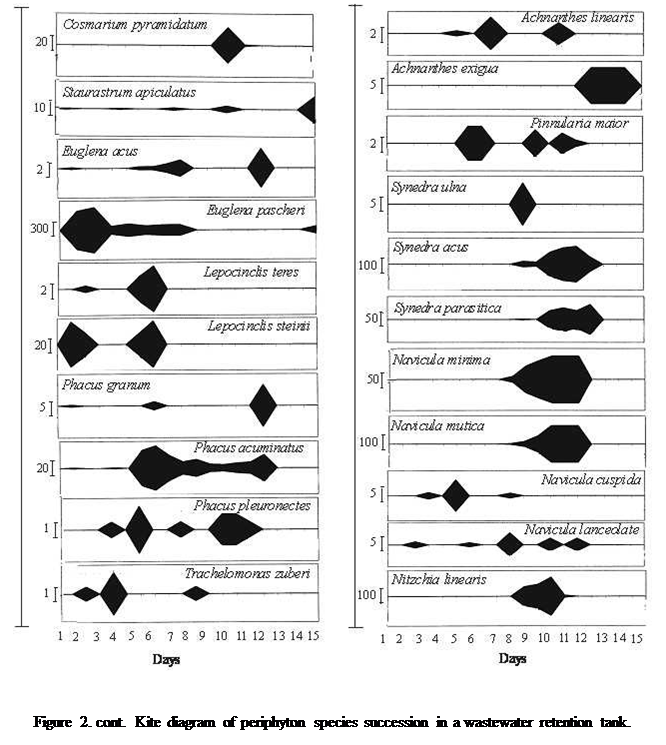
A
total of 50 taxonomic species occurred in the periphyton.
These species were represented by Chlorophyceae (17
species), Cyanophyceae (14 species), Bacillariophyceae (11 species) and Euglenophyceae
(8 species) (Table 2 and Figure 2). Generally, the emergence of species in the periphyton community differed from one species to another
species (Figure 2).
|
Table 2. The periphyton species
observed in the treatment tank during the
depuration study |
||
|
Family |
Species |
|
|
Cyanophyceae |
Anabaena flos-aquae (Lyng) Breb Anabaenopsis arnoldis Aptkarj Anacystis aeuroginosa Kütz. Chroococcus
turgidus (Kützing) Nägeli Rhabdoderma lineare Schmidle et Lauterborn Oscillatoria chalybaea (Mertens) Gom. Oscillatoria terebriformis (Ag.) Gom. |
Chroococus minuta Skuja Gloeocapsa magna (Breb) Kütz Gomphosperia aponina Kütz. Lyngbya pseudospirulina Pascher Merismopedia punctata
Meyen Oscillatoria okenii (Ag.) Gom. Romeria elegans (Wolosz.) Kocz |
|
|
||
|
Chlorophyceae |
Chlamydomonas reinhardtii P.A. Dangeard Chloromonas ulla (Skuja)
Gerloff et Ettl. Euastropsis richteri (Schmidle) Lagerheim. Scenedesmus acornis (Ehr.) Scenedesmus quadricauda (Turpin) Breb. Scenedesmus ovalternus (Bernard) Chodat Scenedesmus obliquus (Breb) Playfair Scenedesmus pseudoarmatus T. Hortobágyi Roya cambrica West & G.S.West |
Ulothrix limnetica Lemmerman Closterium incurvum Bréb. Closterium limneticum Lemm. Cosmarium pyramidatum Bréb Coelastrella levicostata Korshikov Phacotus lendneri Chodat Tetradesmus crocici Fott et Kom
Staurastrum apiculatus (Scott & Prescott) Croasdale & Scott |
|
|
||
|
Euglenphyceae |
Phacus granum Drezepolski Phacus acuminatus
Stokes Phacus pleuronectes (O.F. Müller) Duj. Trachelomonas zuberi Koczwara |
Euglena acus Ehr. Euglena
pascheri Swirenko Lepocinclis teres (Schmitz) Francé Lepocinclis steinii Lemm. |
|
|
||
|
Bacillariophyceae |
Achnanthes linearis (W. Sm.) Grun. Achnanthes exigua Grun. Pinnularia maior (Kützing)
Cleve Synedra ulna (Nitzsch) Ehr. Synedra acus Kütz Nitzschia linearis (C.A. Agardh) W. Smith. |
Synedra parasitica (W. Smith) Hustedt Navicula minima Grun. Navicula mutica Kütz. Navicula cuspida Kutz. Navicula lanceolate (Ag.) Kütz. |
|
|
||
The
species dominant in the early stage of the study (1-2days) were euglenin forms (Euglena pascheri,
E. acus, and Phacus
acuminatus) and constituted 77.5% of the periphyton community. Thereafter, the euglenin
population quickly declined. The decline observed, euglenin
was promptly occupied notably by green algal forms (Chlamydomonas
spp. and Chlormonas ulla) in day 3 and 4, they constituted about
54.5% of the population. The presence of these forms gradually faded and was
replaced by the cyanobacteria, which represented 62% to 87.9% of the periphyton standing stock. Amongst the cyanobacteria, the
dominant species were Anacystis aeuroginosa, Oscillatoria terebriformis, O. chlalybaea,
and Lyngbya pseudospirulina
(Figure 2). The gradual disappearance of the blue green algae gave rise to
diatoms on day 14. The dominant diatom species were Synedra
acus, S. parasitica, Navicula minima, N. mutica, Nitzschia linearis, Achnanthes linearis, and they
constituted 83% of the periphyton standing stock
(Figure 2).
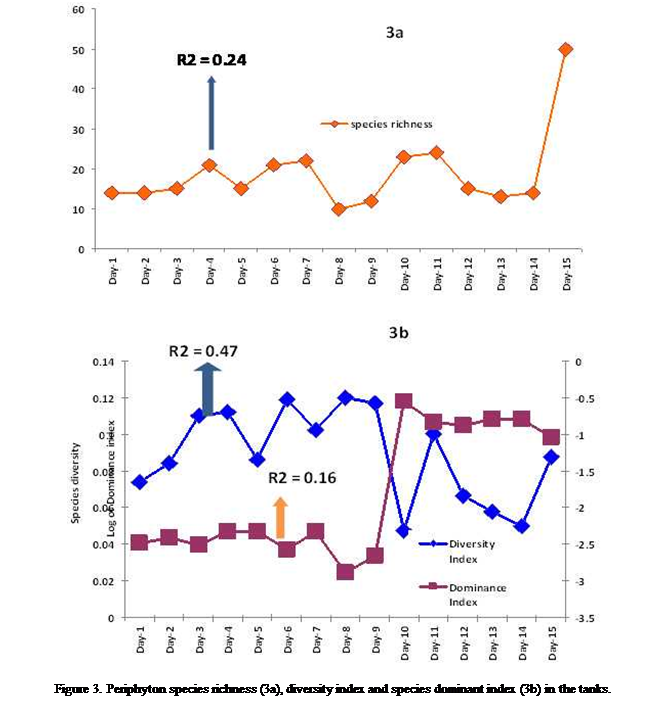
Species
richness fluctuated considerably, maintained almost uniform value for the first
2 days (14 species) before an increase to the day 4 (21 species) subsequently
declined on the day 5 (15 species) before another increase and stable value
between 6th and the 7th day (22 species).
After the 7th day a depression in species number was observed on the 8th day
(10 species) and species richness increased steadily to attain the second peak
on the 10th day (23 species), declined slightly before attaining the
maximum value of 50 species to the end of the experiment (Figure 3a).The species diversity increased initially to the 4th
day and fluctuated there after demonstrated similar pattern as described
for species richness but the peaks (minimum and maximum) did not occur on the
same days (Figure 3b). While species dominance index was stable from day1 to
day 9 (0.0022), the value increased sharply on day 10 (0.2825) and fluctuated
thereafter to the end of the study (Figure 3b) such that dominance index and
species richness demonstrated inverse relationship with the other (Figure 3b).
Changes
were observed in the periphyton community structure pattern
that demonstrated variability at different stages with first development being
the encrusting of Euglenophyceae (72.8-77.6%),
followed by the entrant of Chlorophyceae from day 3
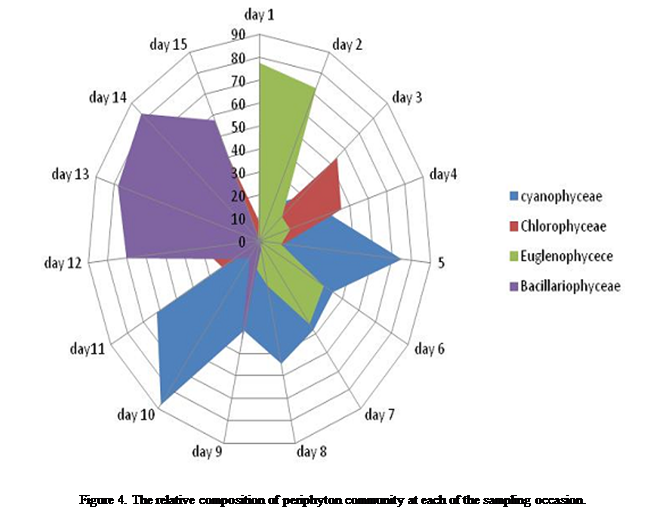
to 4 (44.8-54.5%). Cyanophyceae dominated the periphyton community from day 5 to 11(62-87%), while Bacillariophyceae was observed from day 12 to 15
(57.6-83%), in that respective order (Figure 4). These episodic dominance by
major taxonomic groups influenced series
of patterns observed, such that at the early (day 1 to 2) stages, encrustation pattern was in the decreasing
order of Euglenophyceae (77.6%) > Cyanophyceae (14.2%) > Chlorophyceae
(8.2%) Bacillariophyceae (0%). Thereafter the
changes in encrustation progressed at the mid stages particularly on the 8th
day with a community structure pattern of Cyanophyceae
(54.4%) > chlorophyceae (22.6%) > Euglenophyceae (19.5%) > Bacillariophyceae
(3.5%). At the end of the study another shift in community structure was
observed which followed a sequence of Bacillariophyceae
(57.6%) > chlorophyceae (39.4%) > Cyanophyceae (1.7%) > Euglenophyceae
(1.2%) respectively (Figure 4).
Periphyton standing stock was observed to maintain the same
trend as was observed for species dominance index pattern throughout the study
duration. The highest standing crop of (63111 × 102 indiv/cm2) was obtained on day 10, while the
least standing crop of (287 × 102 indiv/cm2)
was obtained on day 8 of the study (Figure 5a). It was observed that, periphyton standing stock had direct relationship with
dominance index (D), but exhibited inverse relationship with species diversity
index (H').
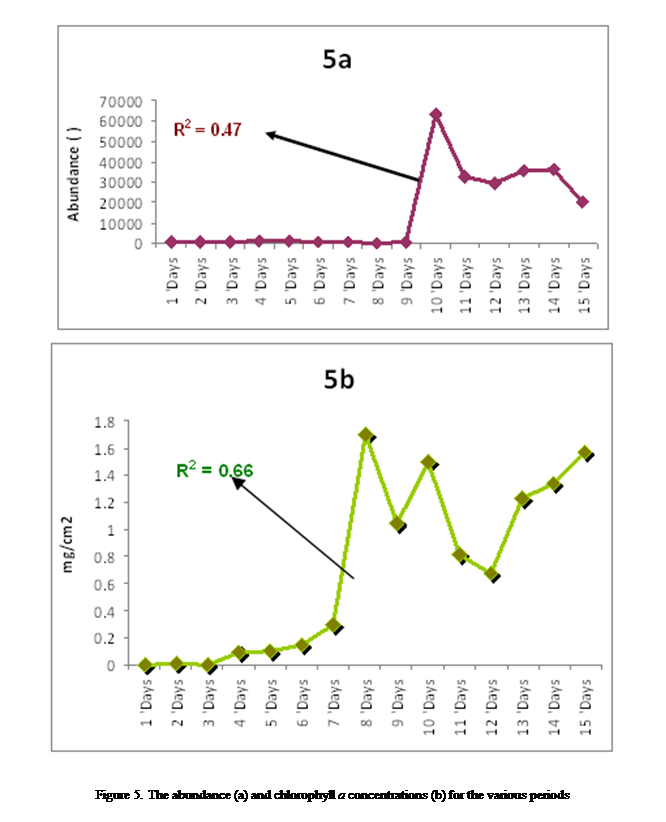
Periphyton Biomass
(chlorophyll a)
Similarly,
chlorophyll a
increased from a minimum of (0.0033mg/cm2) on
day 2 to a remarkable maximum increase (1.6994 mg/cm2)
on day. The chlorophyll a
concentration also demonstrated a strong affinity with
species dominance index and standing stock (Fig. 5b).
Amongst the periphyton descriptors chlorophyll a (R2=
0.66) was the best regressed followed by periphyton
densities (R2= 0.47), Species richness (R2= 0.24),
species diversity (R2= 0.16) = species dominance index (R2=
0.16)
The
correlation coefficient recorded some relationship between the dependent and
independent (physicochemical and biological attribute). Strong positive
relationships were observed between exposure period and biomass (chlorophyll a), DO, pH, abundance, and dominance
index. Chlorophyll a exhibited strong
positively correlation with DO, pH, abundance and Dominance index. Other strong
positive relationships were that between PO4 with Conductivity and
TDS, SO4 with conductivity, turbidity, and TDS and pH with Dominance index.
Moderate positive associations were observed between conductivity with turbidity
and TDS; BOD5 with conductivity, turbidity, TDS, and TSS; NO3
with conductivity, turbidity, and TSS, SO4 with NO3 and PO4;
pH with DO and abundance; and PO4 with Species diversity. Low
positive relationships were observed between Turbidity and TDS; NO3
with BOD5, COD, and PO4; DO with temperature, abundance
and dominance index; and SO4 with COD. Strong inverse relationship
were also observed such as the relationship between exposure period with
conductivity, TDS, NO3, PO4,and SO4;
chlorophyll "a" with conductivity, TDS,PO4; pH with
Conductivity, TDS, NO3 and SO4; Species diversity with
abundance and dominance index. Moderate inverse relationships were observed
between exposure period with Turbidity, BOD5, and COD; chlorophyll a with turbidity, BOD, NO3, SO4
and COD; Conductivity with DO, abundance, and dominance index; DO with
conductivity, turbidity, DO, COD and TDS; TDS with DO, abundance and dominance
index; TSS with COD; PO4 with pH, abundance, and dominance index; SO4
with abundance, dominance index; pH with COD and species diversity index. Low
negative associations were observed only between species diversity with
exposure period and chlorophyll a.
The linear regression model
The predictions on
the response of different water quality parameters during the exposure time and
the relationships with the actual data set from this study were analyzed using
the linear regression model presented in Figures 6a-j.
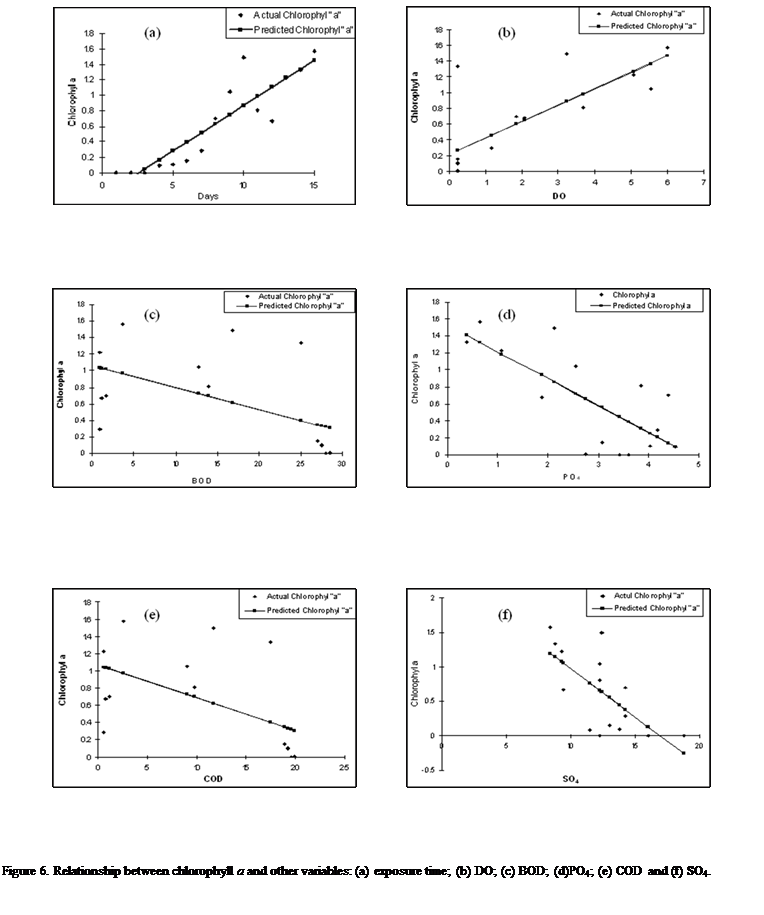
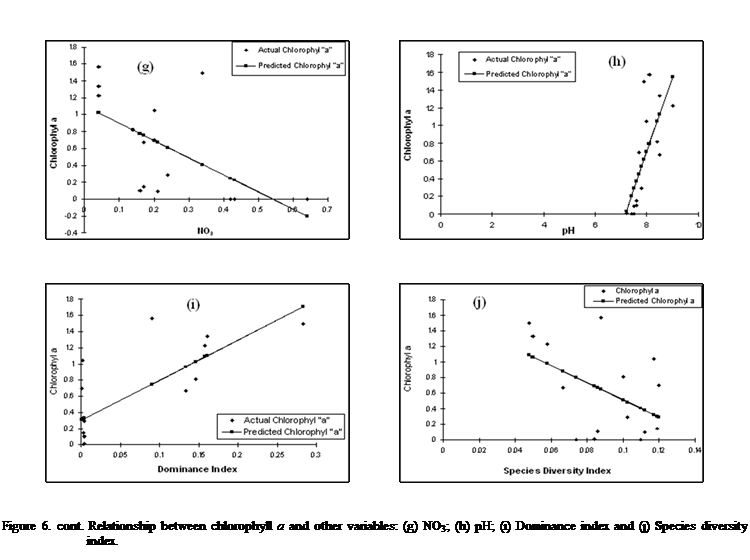
The model showed
the relationship between chlorophyll a and some measured attributes indicated
that while some attributes such as exposure time, DO, dominance index, PO4,
pH, and SO4 were more strongly correlated to the changes in
chlorophyll a as they explained 90, 77, 76, 74 72 and 67% of the variation
respectively (as expressed in equations 1, 2, 3, 4, 5 and 6).
Equation 1:
Chlorophyll a
= 0.1177(t) - 0.3079 (r2= 0.90)
Where t is duration of
exposure, r2 (90%) being changes in chlorophyll a attributed to
exposure period.
Equation 2:
Chlorophyll a
= 0.2081DO + 0.2153 (r=0.77)
Equation 3:
Chlorophyll a
= 4.9688SDI + 0.3019 (r = 0.76)
Equation 4:
Chlorophyll a
= -0.316PO4 + 1.5298 (r =0.74)
Equation 5:
Chlorophyll a
= 0.8422(pH) - 6.0308, (r = 0.72)
Equation 6:
Chlorophyll a
= -0.1399SO4 + 2.3769 (r = 0.67)
While other contributors
with relatively weaker contribution to changes in chlorophyll a are NO3, COD, BOD, species diversity with
contributing influence to in the order of 58, 54 , 53 and 48% respectively (as
expressed in equations 7, 8, 9 and 10).
Equation 7:
Chlorophyll a
= -2.0475(NO3) + 1.1034 (r = 0.58)
Equation 8:
Chlorophyll a
= -0.038 (COD) + 1.0658 (0.54)
Equation 9:
Chlorophyll a
= -0.0266(BOD) + 1.066 (r = 0.53)
Equation 10:
Chlorophyll a
= = -11.095(SDI) + 1.6215 (r = 0.48)
In addition, chlorophyll
a as biomass can
be predicted from a combination of some
critical water quality attributes (DO, BOD and pH) as represented by a
linear regression model in Equation 11):
Equation 11:
Chlorophyll a
= - 3880 +
0.1553Do + 0.0054BOD + 0.5207pH, r2 =
0.7007, n = 15.
This indicated
significantly that 70% of the changes in the chlorophyll a concentration
could be attributed to the values of DO, BOD, and pH in the wastewater.
Similarly, the
prediction can also be defined, using nutrient parameters (N03, P04,
and S04) and is represented by a linear regression model in
Equation 12.
Equation 12:
Chlorophyll – a =1.9636 – 0.8620N03 - 0.0215P04 - 0.0419S04,
r2= 0.6485
Thus, 64% of the
changes in the Chlorophyll a can be attributed
to P04, S04, and N03 values on the coefficient
of determination r2.
DISCUSSION
The physico-chemical changes observed during the treatment
process demonstrated considerable changes for most of the parameters as
reported earlier in a separate report (Chindah et. al. 2005)
The total number of species encountered in the periphyton community during the study was lower than that
observed for the phytoplankton in the same treatment medium (Chindah et al.,
2007). The reasons for the differences may be associated with the fact that all
the emerging species in medium may not be periphytic
in nature. However, most of the species observed in the periphyton
community have been reported in natural stream systems in the Niger Delta
region (Chindah 1998; Chindah
et al., 1999b). The lower number of
species richness observed in the treatment medium vis-à-vis that of natural
water bodies is expected due to continuous and longer period of exposure and
interaction with changes in the water regimes. Nonetheless the phytoplankton
pooled higher species richness than the periphyton
community that recorded lower species richness. This
differences observed in species richness may be associated with the
duration as there may not have been adequate retention as is the case in
natural water bodies (Chindah 2003: Chindah et al.,
1999b).
The
observed increase over time in periphyton species
recruitment and development of periphyton community
suggest that such increment in species probably may be alluded
to individual species requirement to changes in nutrients and other important
environmental gradient factors regulating the pattern observed in the tank.
These factors probably are responsible for the observed sequence in the entrant
of these species at certain water quality.
This is possibly evidence supporting the response and preference of periphyton species to different water quality. Such
predilection influence recruitment pattern as previously reported for
phytoplankton community under similar circumstance (Chindah,
2007), but the periphyton community differed in some
of the species types and in the recruitment and prosperity pattern. This
observation corroborates findings of other scholars that reported distinct changes
in periphyton community as the nutrient gradient
progresses (Lakos et al.,
1997; Pringle 1990; Pan et al., 2000;
Hillebrand and Sommer,
2000).
The
initial occurrence of euglenins, green and blue green
algal species especially the species of Oscillatoria terebriformis, Lyngbya pseudospirulina, Chlamydomonas
reinhardtii. Euglena pascheri,
Lepocinclis steinii,
and Oscillatoria chalybaea
suggest that these are not sensitive species and or species that are resistant
and or indifferent to such increases or even favored by such conditions (opportunistic
species) as the municipal wastewater stressors. Those species therefore are
more tolerant to the stressor where excluded from the population and can be
classified as tolerant species. This
also qualifies these species as indicator species for waste water monitoring.
However,
the later emergence of diatom species that were absent in the early stages
suggest that the waste water contains contaminants that negatively suppress the
development of these species that were absent at the early stages. This
observation is congruent with remarks on other studies in crude oil
contaminated environment (Amadi et al., 1997; Chindah 1998; Pudo and Fubara 1998; Chindah et al.,
1999b). EPA (2002) contends that
municipal and industrial wastes favour the occurrence
and preponderance of some algal species over others especially those species
that have the ability to tolerate unfavorable and extreme conditions. However
the composition of species at the end of the study is similar to trends
observed in natural soft acid freshwater system (Chindah
2003). Thus the improved complexity in species composition in the periphyton community provided ample evidence suggesting
that the depuration resulted in improved water quality thus responsible for
improved status in periphyton species richness and
its diversity. This is in consonance with the observation of Eloranta, 1999 who observed that diatoms community reacts
with changes in water quality within a few days.
Species
richness and diversity were observed to decrease and increase in an oscillating
pattern but in relatively similar manner throughout the study. This pattern
observed may be associated with the shifts in dominance of the periphyton community. This is in agreement with previous
findings in a freshwater stream by Stevenson et al., (1991), Hillebrand and Sommer (2000ab), Stevenson et al., (1991) and who independently observed that decreases in
diversity with colonization time was due to an increased dominance of some
algal species. However, Falomo (1988), Hilleband et al.,
(2000) and McCormick (2001) attributed such changes in marine environment to
alterations in nutrient levels. The high species dominance index is indicative
of the high nutrient concentration and periphyton
standing stock in the wastewater. This result and those by Boyton
et al., 1983; Falomo
1988; Stevenson et al., 1991 and Sabater et al.,
1998) confirm that proliferation of algal species resulted in high dominance index. Consequently an inverse
relationship was observed between species dominance index and species richness
and species diversity index,
The
shift observed in the community structure from the beginning to the end of the
study such that Cyanophyceae >Bacillariophyceae
> Euglenophyceae > Chlorophyceae
in decreasing order of importance is similar to other studies on the impact of
sewage discharges on the water quality and periphyton
communities (Pudo 1985; Chindah
1998 and Chindah et
al., 1999b). The observed reversal in role in the community structure from
the early to the middle and to the end of the study suggests on one hand that
changes of individual species of different taxonomic groups and abundance over
time and on the other hand on competitive ability for nutrient, substrate
surface area and light availability. Earlier studies (Jackson 1977; Hoagland et al., 1982 and Chindah
et al., 1999b) reported similar
results in their periphyton assemblages.
The
dominance of the diatoms species at the later stages of the experiment is
indicative of its positive response to increase DO and reduced BOD5
and nutrient levels, which connotes improved water quality status. Conversely,
the early dominance of euglenin and blue green algae
species is indicative of its firstly attributed to there
preference or tolerance of low pH and DO and high BOD5 and nutrient
suggesting poor water quality. This result is in agreement with previous
reports by Amadi et al., (1997), Chindah (1998) and EPA (1990, 2002), that the preponderance
of blue algae over other forms is indicative of an altered community structure and
poor water quality and the increase of
diatoms species is suggestive of a community that had attained stability
(Chindah et al.,
2007).
The
periphyton standing stock and biomass were
exceptionally higher on day 8 and 10 than those from other days. This may be
attributable to the preponderance of blue green algal forms over others during
the corresponding period. There have
been similar findings by other researchers on primary producers, positing that high
proportions of blue green algae contributed significantly to periphyton abundance and biomass (Brock 1985; Pudo et al.,
1988; Pudo 1989; Vymazal
and Richardson 1995).
However,
Soler et al.,
(1991) in their studies observed that high biomass concentration coincided with
the blooms of chlamydomonas (green algae) in
self-depuration of wastewater body. Form our study; it is difficult to draw
such conclusions as maximum chlorophyll a
was observed when there were reasonable entrants of species from other family
groups in the periphyton community. It is therefore possible to suggest that
chlorophyll a concentration in
wastewater treatment system dependent on the blooms of the different species
possibly due to the fact that the present study did not consider other
chlorophyll types.
The periphyton standing stock and biomass were higher than
those reported in natural black water stream in the region, with considerable
lower nutrient quality status (Chindah 2003; Amadi et al.,
1997). It is therefore possible, to associate the differences in periphyton standing stock and biomass to nutrients. This
observation is in agreement with earlier reports by Borchardt
(1996) that reported that high nutrient availability in a medium yielded high periphyton abundance and biomass.
The inter-relationships of the
physiochemical and biological parameters as reflected in the correlation
coefficient matrix that gives an overview of the role of the water quality
variables on the periphyton community. The strong positive associated observed between
exposure period and some biological attributes (Biomass, chlorophyll a), abundance, and dominance index and physicochemical variable (DO, pH,)
suggested that exposure time played a key role on these attributes. Other similar strong positive association
such as the relationship between biomass (chlorophyll a) in one hand with DO and pH; and secondly with abundance and dominance index implies that
these attributes are important and fundamental characteristics in monitoring periphyton in waste water treatment. The medium and low
positive associations explained elsewhere in this study demonstrate the
critical role played by each of the variable and this is expected in natural
phenomenon. Conversely, the strong negative relationship between the
concentrations of some nutrient parameters such as PO4 and SO4 with
species diversity, dominance index and periphyton
abundance leads to the conclusion, that periphyton
species diversity, dominance index and
abundance, are favourable under nutrient limitation
(Peterson and Grimm, 1992; Alcoverro et al.,
2000). This phenomenon is attributed to relevance of the nutrient imbalance in
the production of extracellular polymeric substances by the benthic or resuspended diatoms under nutrient limitation as posited by
Alcoverro et al., 2000. Generally it is pertinent to suggest that while
some of the variables constitute a defining
factor critical to the depuration process, others appear to be of less
environmental consequences to the system. This result agrees with previous
studies that periphyton biomass decline with increase
in nutrient availability and increase in grazing pressure by epizooic species (McCormick and O¢Dell 1996; Pan et al., 2000; EPA, 2002).
The
critical associations observed between the periphyton
and water quality highlight the importance of water quality and environmental
gradient on the organization of biological resources and the close relationship
between the predicted and actual data implies that these parameters can be
relied upon in waste water treatment monitoring as they provide understanding
of the possible ecologic effects of anthropogenic activities and ecosystem
stability. It is the belief of the
authors that the study has provided a framework in which ecological processes
can be manipulated to achieve a desired phytoplankton community that identifies
successional activities and dynamic factors influencing succession in a
restoring singularly applied treatments.
It is therefore possible to
suggest that while some of the variables are critical to the depuration
process, others appear to be of less environmental consequences to the system.
The predictive model allowed us to conclude that calculations based on biomass
are good descriptors of the studied system, although other units could be
preferentially used in other environments.
CONCLUSION
The
changes observed in some of the physiochemical and biological parameters in
this study are suggestive of the recovery of a wastewater body and such as the
reduction of biological oxygen demand, Chemical oxygen demand, Nitrate and
Phosphate concentrations, as well as the increase in species composition of periphyton assemblages that are indicative of a more stable
aquatic environment.
The periphyton standing stock and biomass have direct
relationship with species dominance, but exhibit inverse relationship with
species diversity.
The
detection of the pattern of succession of euglenins →
green algae → blue green algae → diatoms,
is a very useful tool to discern the stages of the depuration and detect
possible future changes in the composition of the periphyton
community.
ACKNOWLEDGEMENT
We
are grateful to the staff of the Institute of Pollution Studies (IPS), Rivers State
University of Science and Technology, Port Harcourt chiefly U. J. Ikoro, Hanson Uyi, Nathan Nario and Uchenna Anireh for their support and assistance during the
laboratory studies. The collaborations of J. N. Onwuteaka,
A. Osuamkpe and I. Cookey
especially during the compilation and analysis are greatly acknowledged.
LITERATURE
CITED
Abeliovich A. 1986. Algae in wastewater
oxidation ponds: In Handbook of microalgal mass
culture. Richmond .A (ed.) pp331-338. CRC press, Boca Raton, Fla, USA.
Ajayi
S. O. and A. Osibanjo. 1981. Pollution studies on
Nigerian Rivers 11. Water quality of some Nigerian Rivers. Environ.
Pollut 1981, (Series B) 2: 87-95.
Alcoverro, T.; E. Conte and
L. Mazzella. 2000. Production of mucilage
by the Adriatic epipelic diatom Cylindrotheca
closterium (Bacillariophyceae)
under nutrient limitation. Journal of Phycology 36: 1087-1095.
Amadi
E. N.; A. C. Chindah and C. C. Ugoji. 1997. The effect of municipal profainage
on the microflora of a black water stream in Port
Harcourt, Nigeria. Niger Delta Biologia 2 (1):
125-139.
American
Public Health Association (APHA). 1998. Standard methods for
the evaluation of water and waste water. 2th ed, Washington: American Public Health Association.
Brock T. D. 1985. Phytoplankton.
In: T. D. Brock (ed): A Eutrophic lake, Lake Mendota, Wisconsin. New
York, Springer -Verl. p. 85-114.
Borchardt M. A. 1996.
Nutrients In: R. J. Stevenson, M. L. Bothwell and R. L. Lowe (Eds):
Algal ecology (Freshwater Benthic Ecosystems). San Diego: Academic Press. p.
184-228.
Chellapa N. T. 1990. Phytoplankton species
composition, chlorophyll biomass, and primary production of the jundai reservoir (north eastern Brazil) before and after entrophication. J. Acta Hydrobiol.
32 (1/2): 75-91.
Chindah A. C. 1998. The
effect of Industrial activities on the periphyton
community at the upper reaches of New Calabar River,
Niger Delta, Nigeria. Wat. Res. 32 (4): 1137-1143.
Chindah, A. C. 2003. The physico-chemistry phytoplankton and periphyton
of a swamp forest streams in the lower Niger Delta. Scientia
Africana 2 (1&2): 106-116.
Chindah
A. C. and J. Pudo. 1991. A preliminary checklist
of algae found in plankton in Niger Delta, Nigeria. Frag. Flor. Geobot.
36 (1): 112-126.
Chindah, A.C. and O. C. Sibeudu. 2003. Levels of
hydrocarbons and heavy metals in sediment and a decapod crustacean (Crab – Uca Tangeri ). In: The Bonny/New Calabar
River Estuary, Niger Delta. Pol. Journal of Environmental Protection 25/26,
55-71.
Chindah,
A. C.; A. I. Hart and B. Atuzie. 1999a. A preliminary
Investigation on effects of municipal waste discharge on the Macro fauna
associated with macrophytes in a small fresh water
stream in Nigeria. African Journal of Applied Zoology 2: 29-33.
Chindah
A. C.; A. I. Hart and A. Uzoma. 1999b. Periphyton associated with submerged macrophyte
Crinium natans) in
the upper reaches of the new Calabar River, Niger
Delta. Agric Biotech Environ, 1 (2): 37-46.
Chindah, A. C.; S. A. Braide and E. Izundu. 2005. Treatment of
municipal wastewater quality using sunlight. Caderno de Pesquisa. Ser. Bio. (Santa
Cruz do Sul) 17 (2): 27-45.
Chindah, A. C.; S. A. Braide, J. Amakiri and E. Izundu, E. 2007. Succession
of phytoplankton in a municipal waste water treatment system under sunlight. Revista Cientifica UDO Agricola 7 (1):
258-273.
Durand
J. R. and C. Levegue. 1980. Flora et fauna aquatiques de 1’
Afrique. Cah
off Rech. Scio Tech. Outre Mer, 1 :
5-46.
Ekweozor,
I. K. E.; A. Ugbome and E. I. Ombu. 1987. The effects
of chronic oil pollution in the central Bonny esturary. Proceedings of 1987 seminar on
the Petroleum Industry and the Nigerian Environmnet,
Nov. 9-12. PortHarcourt. p. 198-207.
EPA 1983. Municipal wastewater stabilization ponds:
Design manual. United States Environmental protection
Agency, Municipal environmental Laboratory. Cincinnati, Ohio. EPA/625/1-83-015.
EPA 1987. Report on the use of Wetlands for Municipal
wastewater treatment and disposal. United States
Environmental protection Agency Washington, DC. EPA/430/09-88-005.
EPA
1990. Impacts
on quality of inland wetlands of the United States: A survey of Indicators
Techniques and Applications of community level Biomonitoring
Data. United States Environmental protection Agency
Washington, DC. EPA/600/3-90/073
EPA 2002. Methods for evaluating wetlands condition: Using
Algae to Assess Environmental conditions in wetlands. Office
of Water. United States Environmental protection
Agency Washington, DC. EPA-822-R-02-021
Eloranta P, 1999. Applications of
diatoms indices in Finish rivers. In J.Prygiel, B.A.Whitton and Bukoswska J. (eds),
Use of algae in monitoring rivers III. – Agence de l’Eau Artois-Picardic, Douai p.
138-144.
Falomo, R. O. 1998. The impact of industrial
effluents in the distribution of plankton of the Central Bonny Estuary. M. Sc.
Thesis, Rivers State University of Science and
Technology.
Gobo, A. E. 1988. Relationship between rainfall trends
and flooding in the Niger-Benue river Basins. J. Metrology 13: 13.
Gobo, A. E.; I. U. Ubong and P. N. Ede. 2008. Rainfall intensity
analysis as a tool for hydrological and Agricultural practices in Southern
Nigeria. The International Journal of Meterology 33
(334): 344-350.
Hillebramd
H. and U. Sommer. 2000a. Effects of continuous
nutrient enrichment on microalgae colonizing hard substrates. Hydrobiologia 426:
185-192.
Hillebrand
H. and Sommer U. 2000b. Diversity
of benthic Microalgae in response to colonization time and eutrophication.
Aquatic Bet. 67: 221-236.
Hillbrand
H.; B. Worm and H. K. Lotze. 2000. Marine microbenthic
community structure regulated by nitrogen loading and grazing pressure Mar.
Ecol. Prog. Ser. 204:
27-28.
Hoagland, K. D.; S.
C. Roemer and J. R. Rosowski. 1982. Colonization and community structure of two periphyton assemblages, with emphasis on the diatoms (Bacillariophyceae).
Am. J. Bot 69: 188-213.
Ibiebele D. D.; S. A. Braide, A. C. Chindah and F. O.
Harry. 1987. Oshika oil spill incident: Case study
four years after the spill. In Proceedings of the 1987 Seminar on the Petroleum Industry and
the Nigerian. Environment. p. 126-132.
Institute of
Pollution Studies (IPS). 1990. Ecological post impact studies of Ebubu-Ochani oil spillage. Institute of Pollution studies
Rivers State University of Science and Technology, PortHarcourt
Rivers State of Nigeria. RSUST/IPS/TR/90/02, 232 pp.
Izonfuo,
W. A. L.; A. C. Chindah, S. A. Braide
and D. Lawson. A. 2005. Physicochemical
characteristics of different ecotonal streams in a
rapidly developing metropolis in the Niger Delta, Nigeria. Caderno de Pesquisa. Ser.
Bio. (Santa Cruz do Sul Vol) 17 (2): 91-105.
Jackson J. B. C. 1977.
Competition on marine hard substrates: The adaptive significance of solitary
and colonial strategies. Amer. Nat. 111: 743-797.
Joiris, C, and M. I. Azokwu.
1999. Heavy metals in the bivalve Anadara (Senilia senilis)
from Nigeria. Mar. Pollut. Bull. 38 (7): 618-622.
Lakatos
G.; M. K. Kiss, M. Kiss and P. Juha´sz. 1997. Application
of constructed wetlands for wastewater treatment in Hungary. Wat. Res. 15 (5): 341-346.
McCormick P. V. and
M. B. O’Dell. 1996. Quantifying periphyton responses of
phosphorus in the florida
Everglades: A synoptic- experimental approach. J .N Am. Benthol. Soc 15:
450-468.
McCormick P. V.; M.
B. O’Dell, P. B. E. Shuford, J. G. Backus and G.
Kennedy. 2001. Periphyton
responses to experimental phosphorus
enrichment in subtropical Wetland.
Aquatic
Bot. Vol. 71 (2): 119-139.
Mills, F. W. 1932. Some diatoms from Warri,
South Nigeria. Jour. Roy. Microse, 582:
383-395.
Ndiokwere, C. L. 1984. An investigation of heavy metal content of sediments and algae from
the River Niger and Atlantic coastal water. Environ.Pollut. (B) 7: 247-254.
Niger Delta Environmental Survey (NDES). 2000. Ecological zonation and
habitat classification. 2nd Phase Report 2,
Vol.1: 1-66.
Niger Delta Development Commission (NDDC). 2004. Biodiversity of the
Niger Delta Environment Niger Delta Development commission master plan Project
Final report.
Ogan, M. T. 1988.
Examination of surface water used as source of supply in PortHarcourt
area: II. Chemical hydrology. Arch. Hydrobiol. 79 (2/3): 25-342.
Okpokwasili,
G. C. and A. C. Olisa. 1991. Riverwater
biogradation of surfactants in detergents and
shampoos. Water Res. 25 (11): 1425-1429.
Okpokwasili,
G. C and C. N. Nwabuzor. 1988. Primary
biodegradation of anionic surfactants in laundary
detergents. Chemosphere 17: 2175-2182.
Oswald W. J. 1988. Micro-algae and wastewater
treatment. In Micro-Algae Biotechnology. M. A. Borowitzka
and L. J. Borowitzka (Eds),
p. 305-328. Cambridge
University press.
Pan Y.; R. J.
Stevenson, P. Vaithiyanathan, J. Slate and C. J.
Richardson. 2000. Changes in algal assemblages along observed and experimental
phosphorus gradients in a subtropical wetland, Freshw. Biol. 43: 1-15.
Patrick R. and C. Reimar. 1966.
The diatoms of the United States excluding Alaska, and Hawaii, fragilariaceae, Eunotiaceae, Achnanthaceae, Naviculaceae. 688 pp. The Living Stone
Publication, Philadelphia, USA.
Peterson. C. G. and N. B.
Grimm. 1992. Temporal variation in enrichment effects during periphyton successsion in a
nitrogen-limited desert stream ecosystem. J. N. Am. Benthol
Soc. 11 (1): 20-36.
Pringle C. M. 1990. Nutrient
spatial heterogenity effects on community structure,
physiognomy, and diversity of stream algae. Ecology 71: 905-920.
Powell, C. B. 1987.
Effects of freshwater oil spillages on fish and fisheries.
The Proceedings of 1987 Seminar on the Petroleum Industry and
the Nigerian Environment.
Pudo J. 1985. Investigation
on algae in the oil spilled region of the Bonny River. In: Proc. Ecolog. Society
of Nigeria Annual Conference. Nigeria: Port Harcourt. p. 171-177.
Pudo
J. K. and D. M. J. Fubara. 1988. Studies in
the periphyton algae in the petroleum spillage area
of the Niger aquatic system. Veih. Inter. Ver. Limnol 23; 2259-2261.
Pudo J. 1989. Ekologiczne skiki zanicezyszcznia ropa naflowa poludniowej Nigerii (South Nigeria -ecological
consequence of crude oil water pollution)
Gosp Wodna 4: 85-87.
Reseasch Planning Institute
(RPI) 1985. Columbia South Carolina, USA. Environmnetal
Baseline Studies for the establishment of Control Criteria and Standars against Petroleum Related Industries in Nigeria. RPI/R/84/4/15-17.
Sabater,
S.; J. S. V. Gregory and J. R. Sedell. 1998. Community dynamics and metabolism of benthic
algae colonizing wood and rock substrata in a forest stream. J. Phycol 34:
561-567.
Shannon C. E and W.
Weaver. 1964. The mathematical theory of communication. Illinois, Urbana press,
125pp.
Sieminiska’s,
1964. Chrycophyta 11 Bacillariophyceae. Okrzemia In:
K. star Mach (ed) Flora Slokowodna
Polski: Fresh waterflora of
Poland” 4.502
pp.
Soler,
A.; J. Saez, M. Llorens, I.
Martinez, F. Torrella and L. Berna. 1991. Changes in physico-chemical parameters and photosynthetic
microorganisms in a deep wastewater self-depuration lagoon. Wat. Res., 25 (6):
689-695.
Starmach, K. 1975. Chytophyceae – Kryptofity, Dinophyceae-dirofity,
Raphidophyceae – rafidofoty
– In: “flora of poland” 4. 502 pp. Parnstwowe, whydawnietwo, Nankowe, Warszawa (in polish).
Stevenson, R. J.;
C. G. Peterson, D. B. Kirschtel, C. C. King and N. C.
Tuchman. 1991. Density dependent growth,
ecological strategies and effects of nutrients and shading on benthic diatoms
succession in streams. J. Phycol. 27: 59-69.
Vyzamal
J. and C. J. Richardson. 1995. Species composition, biomass and nutrient
content of periphyton in the Florida Everglades. J. Phycol. 31:
343-354.
Página diseñada por Prof. Jesús Rafael Méndez Natera
TABLA DE CONTENIDO DE LA REVISTA CIENTÍFICA UDO
AGRÍCOLA