Revista Científica UDO Agrícola Volumen 6. Número 1. Año 2006. Páginas: 11-19
Role of some agronomic traits for
grain yield production in wheat (Triticum aestivum L.)
genotypes under drought
conditions
Papel de
algunos caracteres agronómicos en el rendimiento de semillas de genotipos de
trigo (Triticum aestivum L.)
bajo condiciones de sequía
Waqas Manzoor Bhutta
Centre of Advanced Studies in Applied Genetics and Saline Agriculture
(CAGSA), University of Agriculture, 38040, Pakistan. E-mail: mosaf_1@yahoo.com.
|
Received: 05/29/2006 |
Reviewing ending: 08/09/2006 |
Review received: 11/15/2006 |
Accepted: 11/21/2006 |
ABSTRACT
The association of
some agronomic traits among wheat lines and their direct and indirect influence
on the grain yield of wheat were investigated. In order to do this study,
experiment with 25 breeding lines was conducted in a randomized complete block
design with three replications. According to the results, the correlation and path analyses of grain yield and its
components in promising wheat lines revealed
that there is strong positive association of grain yield with number of tillers and number of spikes per
plant. Grain yield was negatively
associated with number of florets per
spike. Comparatively, high genetic
variation was found in grain
yield, flag leaf area, and tillers
per plant. Number of tillers per plant
had direct effect on grain yield
and majority of the traits affected grain yield through it.
Key words: Wheat, Triticum aestivum, cross breeding, path
analysis
RESUMEN
La asociación de algunos caracteres agronómicos entre líneas de trigo y su influencia
directa e indirecta sobre el rendimiento de semillas en trigo fue investigada.
Se realizó un experimento con 25 líneas mejoradas en un diseño de bloques
completos al azar con tres repeticiones. De acuerdo a los resultados, los
análisis de correlación y de trayectoria del rendimiento de semillas y sus
componentes en líneas promisorias de trigo revelaron que hay una fuerte
asociación positiva del rendimiento de semillas con el número de hijuelos y
número de espiguillas por planta. El rendimiento de semillas estuvo
negativamente asociado con el número de florecillas por espiguilla.
Comparativamente, se encontró una alta variación genética en el rendimiento de
semillas, área foliar de la hoja bandera e hijuelos por planta. El número de
hijuelos por planta tuvo un efecto directo sobre el rendimiento de semilla y la
mayoría de los caracteres afectaron el rendimiento de semillas a través del
número de hijuelos por planta.
Palabras clave: Trigo, Triticum aestivum, mejoramiento
de plantas, análisis de trayectoria
INTRODUCTION
Wheat is grown both in arid and
semi-arid regions of the world. Increasing wheat production under abiotic
stress conditions has become important in recent years, since wheat production in
areas with optimum growing conditions does not meet the needs of the increasing
population. Drought resistance is a general term and could refer to any of
several types of drought resistance such as drought escape, dehydration
avoidance or dehydration tolerance. Breeding wheat for drought resistance is a
difficult, long-term project. Present cultivars were developed by yield testing
in a range of environment from fully irrigated to severely drought stressed.
Perhaps physiologically based screening techniques can be utilized to improve
selection of parental material or to rapidly screen large segregation
populations to improve the level of drought resistance prior to yield testing.
Morphological parameters like plant height, flag leaf area, days to heading,
tillers per plant and grain yield etc. related to drought resistance has
already been identified by plant physiologists. Grain
yield is a product of several contributing factors and can be estimated on the basis of performance of various components.
The
breeding procedure for drought tolerance depends upon the pattern of
inheritance (qualitative or quantitative), the number of genes with major
effects, and the nature of the action of those genes (Rao
and McNeilly, 1999). There is now a considerable body
of information about variation both between and within species in response to
drought (
Path analysis disintegrates the correlation into direct and indirect contributions of a particular trait to
yield. This disintegration helps in
ranking the traits of
plants, which can be utilized for indirect selection. The correlation and path
analyses were estimated for different plant traits in promising lines of
wheat to evolve high yielding wheat
genotypes. Path analysis was performed as a supplement for correlation analysis to
elucidate the interrelationships among characters determining grain yield.
MATERIAL AND METHODS
Genotypes
The experimental material comprised of
25 selected wheat lines viz. Hd-2169, Hd-2179, Hd-2204, Hd-2285,
Hd-2329, C-271, C-273, C-518, C-591, Maxipak, Blue Silver, Wl-711, Chenab-70,
Lyalpur-73, Pothowar, Punjab-81, Faisalabad-83, Shalimar-88, Pak-81, Punjab-85,
Faisalabad-85, Kohnoor-83, Chakwal-86, Rawal-87 and Pasban-90
locally adapted cultivars were chosen for studied based on their reputed
differences in yield performance and drought resistance.
Irrigation × Cultivar
Field irrigation studies were
conducted. Irrigation was in level basins
Germination in Mannitol
Fungicide treated seed was germinated
at 22 º C in
Survival after desiccation
Wooden flats 425 x 550 x
Water Loss of Excised Leaves
Plants were grown in greenhouse
flats as described in the previous section and sampled at the tillering stage
when
Root length
Ten seeds of each cultivar were
planted in sand in
Rooting Depth
Wheat seedling was grown 40 d in
The same genotypes were also planted
in triplicate randomized block design in the field under moisture stress
conditions (zero irrigation). The genotypes
were sown
with the help of a Rabi
drill in a randomized complete
block design with four
replications in the field under moisture stress conditions (zero
irrigation). The distance between rows and plants was kept 22.5 and
Plant height (cm)
Plant height of central spike
(mother shoot) of each plant was measured in cm from the Ground level to the
apex of the spike excluding awns.
Flag leaf area (cm2)
Flag leaf area of mother shoot of
randomly selected plants in each replication was measured in cm2 with
electric leaf area meter and then average was calculated
Number of tillers per plant
Numbers of tillers per plant were counted on each
plant in each family.
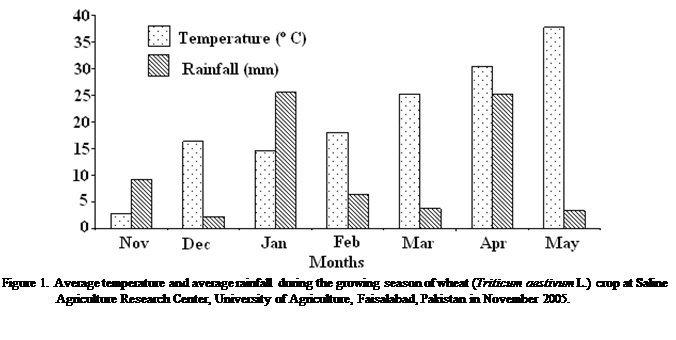
Grain Yield (g)
Grain yield in gram from each
selected plants was recorded separately on electronic balance, average yield
was then computed. The average temperature and average rain fall during the
growing season of the wheat crop is shown in Figure 1.
Statistical Analysis
Variances and covariance analyses
for all the traits studied were performed using the method given by Steel and
Torrie (1980). The estimates of genotypic correlations were computed according
to the method given by Kwon and Torrie (1964). The sampling of genetic
correlations was tested as suggested by Reeve (1955). Path coefficient analysis
was performed as described by Dewey and Lu (1959). Grain yield was kept as
resultant variable and other traits as causal ones. Heritability in broad sense
as a ratio of genotypic to phenotypic variance and Standard Error (S.E.) for
heritability was computed for each trait. Genetic advance was calculated at 20
per cent selection intensity (i = 1.4). Genotypic and phenotypic coefficients
of variation were calculated for the estimation of variability.
RESULTS AND DISCUSSION
Heritability and Genetic advance
Results
pertaining to various genetic parameters viz.,
coefficient of genotypic (GCV) and phenotypic variation (PCV) and the
estimates of heritability and genetic advance are presented in (Table 1).
The significant estimates of
heritability in broad sense associated with all the traits under study
except root length. High genetic advance was obtained by 20 % selection intensity for plant height (
|
Table 1. Various genetic parameters in wheat (Triticum aestivum L.) at |
||||
|
Traits |
Genotypic coefficient of variation |
Phenotypic coefficient of variation |
Heritability † ± S.E. |
Genetic advance |
|
Plant height (cm) |
15.46 |
19.76 |
0.61 ± 0.08 |
1.4 |
|
Leaf area (cm2) |
6.70 |
7.17 |
0.87 ± 0.03 |
7.5 |
|
Germination in mannitol |
2.17 |
2.23 |
0.94 ± 0.08 |
3.05 |
|
Survival desiccation |
12.33 |
14.87 |
0.68 ± 0.06 |
2.33 |
|
Water loss excised leaves |
12.19 |
14.85 |
0.67 ± 0.06 |
2.23 |
|
Root length (cm) |
4.92 |
6.57 |
0.56 ± 0.03 |
3.6 |
|
Root depth (cm) |
5.24 |
6.64 |
0.62 ± 0.09 |
139 |
|
Tiller number/plant |
1.02 |
1.69 |
0.36 ± 0.60 |
1.65 |
|
Grain yield/Plant (g) |
22.88 |
24.47 |
0.87 ± 0.04 |
5.70 |
|
† Heritability
estimate is significant if its calculated value exceeds twice of its standard
error (S.E) |
||||
Correlation analysis
Genotypic
correlation coefficients
along with their standard errors
are presented in (Table 2). The results indicate that plant height was
positive and significantly correlated with germination in mannitol, water loss
of excised leaves and root length but negative and significantly with survival after
desiccation, root depth, tiller number per plant and grain yield at genotypic
level that is in agree with Khan et al.
(2003). Flag leaf area was positive and significantly correlated with
germination in mannitol, survival after desiccation, and water loss of excised
leaves, tiller number per plant and grain yield. Flag leaf area showed
negatively significant genotypic correlation with root length and root depth.
In the other hand, germination in mannitol had positive genotypic correlation
with water loss of excised leaves, root length, root depth and grain yield but
tiller number per plant showed negative and significantly correlation with
germination in mannitol (Munns et al.,
2003).
|
Table 2. Genotypic
correlation matrix along with their standard errors in two rowed wheat (Triticum
aestivum L.) at |
|||||||||
|
Traits |
Plant
height (cm) |
Flag leaf area (cm2) |
Germination
in mannitol |
Survival
desiccation |
Water
loss excised leaves |
Root
length |
Root
depth |
Tiller
number/plant |
Grain yield plant (g) |
|
Plant height (cm) |
1 |
- 0.079 0.049 |
0.225 * 0.023 |
- 0.479 * 0.046 |
0.483 * 0.063 |
0.336 * 0.053 |
- 0.206 0.099 |
- 0.501* 1.808 |
- 0.2626 0.2860 |
|
Flag leaf area (cm2) |
|
1 |
0.609 * 0.025 |
0.266 * 0.028 |
0.273 0.038 |
- 0.760 * 0.018 |
- 0.725 * 0.024 |
0.307 * 1.090 |
0.2815 * 0.1409 |
|
Germination in mannitol |
|
|
1 |
0.200 0.047 |
0.213 * 0.064 |
0.403 * 0.058 |
0.402 * 0.070 |
- 0.351* 2.424 |
0.2141 * 0.2370 |
|
Survival desiccation |
|
|
|
1 |
0.999 * 0.001 |
0.449 * 0.029 |
- 0.303 0.057 |
0.881 * 1.137 |
0.889 * 0.0390 |
|
Water loss excised leaves |
|
|
|
|
1 |
- 0.417 0.039 |
- 0.323 0.076 |
0.862 * 0.512 |
0.8924 * 0.0518 |
|
Root length |
|
|
|
|
|
1 |
0.946 * 0.006 |
- 0.472 * 1.137 |
- 0.414 * 0.1540 |
|
Root depth |
|
|
|
|
|
|
1 |
- 0.157 2.439 |
- 0.232 0.3009 |
|
Tiller number/plant |
|
|
|
|
|
|
|
1 |
0.926 * 1.050 |
|
* Significant (p ≤ 0.05) |
|||||||||
Survival
after desiccation has a positive and significant correlation with water loss of
excised leaves, root length, tiller number per plant and grain yield, but root depth
was only negatively non-significant with survival after desiccation. Water loss
of excised leaves was show significant positive relation with tiller number per
plant and grain yield. It is suggested that genotypes having better
contribution and utilization of soil moisture can produce more number of
tillers per plant ultimately adding to grain yield. Therefore, results
suggested that grain yield was correlated positively with flag leaf area,
germination in mannitol, survival desiccation, water loss of excised leaves and
tiller number per plant at genotypic level. Grain yield showed a negative
significant genotypic correlation with plant height and root length but root
depth negatively non-significant correlated with grain yield under drought
conditions. The results obtained for mature plant showed that grain yield was
positive and significantly correlated with flag leaf area at genotypic level
and with number of tillers per plant at the genotypic level but flag leaf area
non-significant correlated with grain yield at phenotypic level (Muraila et al., 2001).
Path analysis
The results
pertaining to path analysis are presented in (Table 3) and discussed here
under: Direct effect of plant height on grain yield was negative,
whereas its indirect effects via
germination in mannitol was positive while all the other traits were negative. The direct effects of flag leaf area
on grain yield was positive (Ali et al.,
2002; Masauskiene et al., 2001). The indirect effect via plant height, germination in
mannitol, survival after desiccation, water loss of excised leaves and no of
tiller per plant were positive while the other traits indirect effect of flag
leaf area via root length and root depth were negative. The results thus
obtained suggest that flag leaf area is an important component of yield and
hence needs special attention in selection strategies (Singh, 1999). The direct effects of germination in mannitol on grain
yield was positive and low and indirect effects germination in mannitol via
plant height, flag leaf area and no of tiller per plant were also positive
while all the other traits were negative indirect effects with germination in
mannitol. Survival after desiccation influenced yield negatively direct and
indirectly through root length and root depth. Mainly these traits contributed
to yield through plant height (Kamal et
al., 2003; Kumar and Ramesh, 2001).
This may be attributed to the differences in experimental material and environmental conditions under which the experiment was conducted. The direct effect of
root length to grain yield was negative. Whereas, its indirect effects through
all other traits were positive except the root depth. Tillers per plant
contributed grain yield directly at the maximum level. However, its
own indirect effects via flag leaf area, germination in mannitol and water loss of excised
leaves (Huang Zuliu et al.,
2000). While the other traits plant height, root
length and root depth made their maximum negative indirect effect to number of
tiller per plant through these traits (Khattab et al., 2001; Hanchinal and Ramed, 1999).
|
Table 3. Direct (in
parenthesis) and indirect effect matrix in two rowed wheat (Triticum aestivum
L.). Dependent variable is grain yield/plant. The last column shows genotypic
correlations of independent variables with grain yield/plant at |
|||||||||
|
Traits |
Plant height (cm) |
Flag leaf area (cm2) |
Germination
in mannitol |
Survival
desiccation |
Water loss from excised leaves |
Root
length |
Root depth |
Tiller
number/plant |
Grain yield plant (g) |
|
Plant
height (cm) |
(- 0.0908) |
0.0102 |
0.0148 |
0.2558 |
4.3747 |
0.0767 |
- 0.0553 |
-4.9803 |
-0.2626 |
|
Leaf area (cm2) |
- 0.0072 |
(0.1278) |
0.0402 |
- 0.1565 |
- 2.4696 |
0.1739 |
- 0.1941 |
2.767 |
0.2815 |
|
Germination
in mannitol |
0.0204 |
0.078 |
(0.0659) |
0.1794 |
- 1.9369 |
- 0.0921 |
0.1075 |
2.0797 |
0.2741 |
|
Survival desiccation |
- 0.0435 |
0.034 |
- 0.0132 |
(- 0.4496) |
- 9.0561 |
0.1027 |
- 0.0811 |
(10.3958) |
0.889 |
|
Water loss from excised leaves |
- 0.0439 |
0.0349 |
- 0.0141 |
- 0.4398 |
(- 9.0572) |
0.1046 |
- 0.0864 |
10.3944 |
0.8924 |
|
Root
length (cm) |
- 0.0305 |
- 0.0973 |
- 0.0266 |
0.2407 |
4.1447 |
(- 0.2286) |
0.2532 |
- 4.6696 |
- 0.414 |
|
Root
depth (cm) |
- 0.0188 |
- 0.0928 |
- 0.0265 |
0.0802 |
2.9267 |
- 0.2163 |
(0.2675) |
- 3.1522 |
- 0.232 |
|
Tiller
number/plant |
- 0.0456 |
0.0392 |
0.0230 |
- 0.5099 |
- 7.8127 |
0.1079 |
- 0.0421 |
(9.1661) |
0.9263 |
CONCLUSION
The overall results indicated that
there is genetic variability present in the material studied. The genotypes C-591
and Blue Silver appeared to be drought tolerant whilst the other genotypes. The
drought stress showed drastic effect on plant growth and grain yield. The
results suggested that the traits like Flag leaf area, Germination in mannitol
and tiller number per plant due to their genetic basis and significant
correlation with grain yield, could be used as selection criteria to identify
drought tolerant wheat genotypes, The genetic information derived from these
studies further suggested that the traits having additive type of gene action
would be helpful to improve drought tolerance in wheat. Further investigations
are needed to derive sounder conclusion for the development of drought tolerant
wheat genotypes, to bring the droughty prone areas under wheat cultivation.
Such type of breeding programme may lead to improve the economic condition of
stack-holders in general and farmers living in drought-affected areas in
particular.
LITERATURE CITED
Ali, Z., A. S. Khan and M. A. Asad. 2002. Drought tolerance in wheat:
Genetic variation and heritability for growth and ion relation. Asian Journal
of Plant Sciences l: 420-422.
Ashraf, C. M. and S. Abu-Shakra. 1978. Wheat seed germination under low
temperature and moisture stress. Agronomy Journal 70; 135-139.
Ashraf, C. M. and T. McNeilly. 1988. Variability in
salt tolerance of nine spring wheat cultivars. Journal of Agronomy and Crop
Science 160: 14-21.
Dewey, R. D. and K. H. Lu. 1959. Correlation and path-coefficient
analysis of components of crested wheat grass seed production. Agronomy Journal
51: 515-518.
Fathi, G. H. and K. Rezaeimoghddam. 2000. Path analysis of grain yields
and yields components for some wheat cultivars in
Gonzalez, A.,
Hanchinal, R. R. and B. C. Maled. 1999. Path analysis in wheat.
Karnataka Journal of Agricultural Sciences 12 (1-4): 183-185.
Huang Zuliu, Pan Yuping and Z. L. Huang. 2000. Path analysis of quality
and agronomic characters in wheat germplasm.
Journal Yang Zhou University Natural Sciences 3 (1): 36-40.
Kamal, A., M. S. Qureshi, M. Y. Ashraf, and M. Hussain. 2003. Drought
induced changes in some growth and physio-chemical aspects of two soybean (Glycine
max (L) Merr.) genotypes. Pale Journal of Botany 35: 93-97.
Khan, A. S., M. A Asad and Z, Ali. 2003, Assessment of genetic
variability for drought tolerance in wheat. Pakistan Journal of Agricultural
Science 40: 33-36.
Khattab, S. A. M., M. A. M. Gomaa and S. A. N. Afiah, 2001. Nature of
gene action in wheat crosses under normal and drought stress conditions. Arab
University Journal of Agricultural Sciences 9:297-311.
Kumar, B. S. T. and B. Ramesh. 2001. Correlation between spike
development and internode elongation in barley (Hordeum vulgare L.). Indian Journal of Agricultural Sciences 71
(11): 717-718.
Kwon, S. H. and J. H. Torrie. 1964. Heritability and interrelationship
among traits of two soybean populations. Crop Science 4: 196-198.
Masauskiene,
A., V. Paplauskiene and A. Leistrumaite. 2001. The effect of cultivar
on the variation of spring wheat grain quality and yield and correlation among
these indicators. Zemdirbyste, Mokslo-Darbai.73: 194-209.
Miralles, D. J., R. A. Richards and G. A. Slafer. 2000. Duration of the
stem elongation period influences the number of fertile florets in wheat and
wheat. Australian Journal of Plant Physiology 27: 931-940.
Mujeeb-Kazi, A. and R. Delgado. 1998. Bread wheat/D genome synthetic
hexaploid derivative resistant to Helminthosporium
sativum spot blotch. p. 297-
Munns, R, and R. A. James. 2003. Screening methods for drought tolerance
a case study with wheat. Plant and Soil. 253: 201-218.
Muralia,S. and E. V. D. Sastry. 2001. Correlation for germination and
seedling establishment characters in wheat under normal and drought
environments. Indian Journal of Genetics and Plant Breeding 61: 69-70.
Reeve, E. C. R. 1955. The variance of the genetic correlation
coefficients. Biometrics. 11: 357-374.
Royo,
C., M. Abaza, R. Blanco and L. F. Garcia del Moral. 2000. Triticale grain growth
and morphometry as affected by drought stress, late sowing and simulated
drought stress. Australian Journal of Plant Physiology 27: 1051-1059.
Salam, A., P. A. Hollington, J. Gorham, R.G. Wyn Jones and C. J.
Gliddon. 1999. Physiological genetics of salt tolerance in Triticum aestivum
L: Performance of wheat varieties, inbred lines and reciprocal F1 hybrids
under saline conditions. Journal of Agronomy and Crop Science 183: 145-156.
Singh, B. P. 1999. Correlation study in barley (Hordeum vulgare L.). Journal of Applied
Biology 9 (2): 143-145.
Steel, R.G.D. and J. H. Torrie, 1980. Principles and
Procedures of Statistics: A Biometrical Approach. McGraw Hill Book Co.,
Zhong-Hu, H. and S. Rajaram. 1994. Differential responses of bread wheat
characters to high temperature. Euphytica
72:197-20.
Página diseñada por Prof. Jesús Rafael
Méndez Natera
TABLA
DE CONTENIDO DE LA REVISTA CIENTÍFICA UDO AGRÍCOLA